Souppe Studio: your portfolio is not a spreadsheet
Most investing tools trap your portfolio in a grid of numbers. Souppe Studio puts the full Souppe engine behind a living picture you build by hand and watch respond in real time.
The grid we never questioned
Open almost any investing tool and you land in the same place. A grid. Rows of tickers, columns of numbers, a balance that ticks green or red through the day. The industry has spent decades polishing that grid and almost no time asking whether a grid is the right way to understand what you own.
It is not. A table can tell you the names and the weights. It cannot show you the shape. It cannot show you which holdings lean on the same part of the market, where your downside risk quietly piles up, or how the whole portfolio would behave when conditions turn. That information has always existed. It has simply been locked inside tables that only a specialist can read.
Souppe Studio takes it out of the tables.
What Souppe Studio is
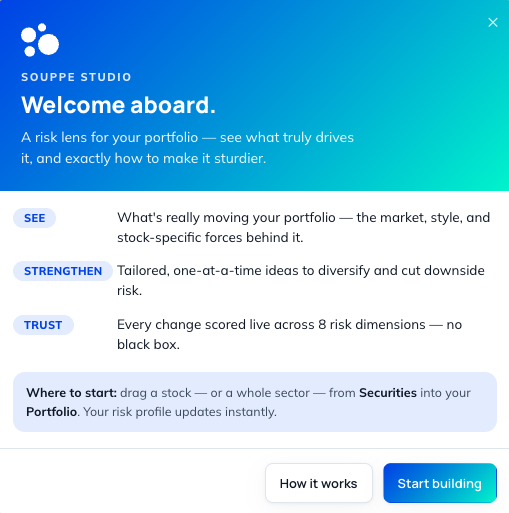
Souppe Studio is a visual portfolio builder you open in the browser. You see the market as a living map, you build a portfolio by dragging pieces of it into place, and you watch the structure respond as you go. The full Souppe engine runs underneath, and every result it produces appears on screen as a picture.
You can try it at studio.souppe.ai.
You see the whole market at once
Studio draws the market the way it is actually organized, as a field of bubbles grouped into sectors and industries. Each company is a circle, sized by how large it is, sitting next to the names it belongs with. Instead of typing a ticker into a box and hoping you remembered the right one, you see the whole landscape at once and reach for the part you want. Browsing the market becomes something you do by sight.
You build with your hands
Add a single company by dragging it in. Or grab an entire sector or industry and drop the whole group in at once. Set the weights by feel and adjust them in place. The portfolio takes shape under your hands instead of being typed line by line into a form. Building starts to feel like arranging, which is what it always was.
You watch it respond
This is where Studio breaks from everything that came before it. The instant you add or remove a holding, the read updates in front of you. The 8 risk dimensions move. The three plain-language scores, how Crash-Resistant the portfolio is, how much Growth it captures and how All-Weather it stays, shift to match the new shape. You can also see what is really moving the portfolio, how much of it rides on the broad market, how much on style tilts and how much on the individual companies you hold. Every change is scored live and in the open, so the read is never a black box. Try a name, watch the picture change, then keep it or pull it back out. Understanding your portfolio stops being a thing you study after the fact and becomes a thing you see while you build.
Studio also points to specific names that would shore up the soft spots, one idea at a time, and shows what each one would do to the shape before you commit to it. Most ideas are there to diversify the portfolio or cut its downside risk. The holdings you believe in stay. The engine strengthens what surrounds them.
The same engine, now visible
Studio runs the complete Souppe model. The same engine that read 500 disclosed institutional portfolios last quarter and improved 88% of them with its first suggestion is the one running while you drag bubbles around the screen. Nothing about the depth of the analysis was traded away to make it visual. What changed is the surface. The result that used to sit encoded in a table now forms in front of you as you build.
That matters because of how people actually understand risk. A table asks you to hold a dozen numbers in your head and imagine how they fit together. A picture does the holding for you. We reason about shapes and movement far better than we reason about rows, and a portfolio's risk is fundamentally a matter of shape, of how the parts move together and where the weight sits. Studio is built around that fact. The rigor lives inside the engine. The clarity lives on the screen.
Putting it together
For a long time, portfolio management has dressed itself up as a spreadsheet discipline, as if understanding your own money required reading a ledger only an analyst could parse. It never did. The math under the hood is serious, and it stays serious. The way you meet it does not have to be.
Reading a spreadsheet tells you what you own. Seeing your portfolio in Souppe Studio shows you what it is. The names were always the easy part. The shape is what carries you through the next hard market, and now you can watch it take form, one piece at a time, at studio.souppe.ai.